What Percentage of Retirees Have $2 Million Dollars (Chart Comparison)
POINTS
-
Only a small share of U.S. retirees have a $2 million net worth, placing them among the wealthiest retirement-age households.
-
A $2 million net worth includes all assets minus debts, not just 401(k)s and IRAs.
-
The typical U.S. retiree has far less than $2 million in total wealth.
-
Reaching $2 million typically requires decades of consistent saving, investing, and compound growth.
-
Having $2 million in retirement accounts alone is significantly rarer than having a $2 million net worth.
-
A $2 million nest egg can support a comfortable retirement, but spending, taxes, and healthcare costs determine how long it lasts.
Most U.S. retirees never reach $2 million in retirement savings, placing that balance well outside the typical range.
Data from the FRSCF and analysis by the Employee Benefit Research Institute show only a small share of households at that level.
| Wealth / Savings Level | Estimated Share of Retirees (Households 55+) |
|---|---|
| $0 – $100K | ~30%–35% |
| $100K – $500K | ~25%–30% |
| $500K – $1M | ~10%–12% |
| $1M – $2M | ~5%–6% |
| $2M+ | ~1%–2% (≈ 1.8%) |
https://www.ebri.org/
https://www.federalreserve.gov/econres/scfindex.htm
Net Worth vs Retirement vs Investable Assets
Net worth is the broadest measure and includes every asset minus every liability, such as your mortgage, loans, and any other debt.
So, it includes your
- Home equity
- Other real estate
- 401(k) and IRA balances
- Taxable brokerage accounts
- Cash savings
- Vehicles
- Business equity, all of it.
Retirement assets are narrower; it typically means only the tax-advantaged accounts specifically:
- 401(k)s
- IRAs
- Pension balances.
Investable assets are narrower still, generally liquid financial holdings like
- Stocks
- Bonds, and
- Cash, excluding real estate and life insurance.
For this analysis, let’s focus on net worth, the full household picture, home equity included, because that’s the number that actually determines a retiree’s financial flexibility.
Wealth Distribution Among Retirees (Households Age 65+)
Ages 65–74
Net worth is often still climbing through this span, typically reaching its highest point around age 70–74 before later withdrawals and spending start drawing balances back down.
Ages 75–79
Median net worth has fallen noticeably from its early-70s peak, as years of required withdrawals and everyday spending steadily draw savings down.
Ages 80 and Older
Typical net worth is at its lowest point here, though wealth stays highly concentrated — a smaller, wealthier share of households still hold several million dollars or more.
All Retirees, Age 65+
Across every age group, retiree wealth is heavily concentrated at the top. Most households hold a few hundred thousand dollars, while a small share controls several million or more.
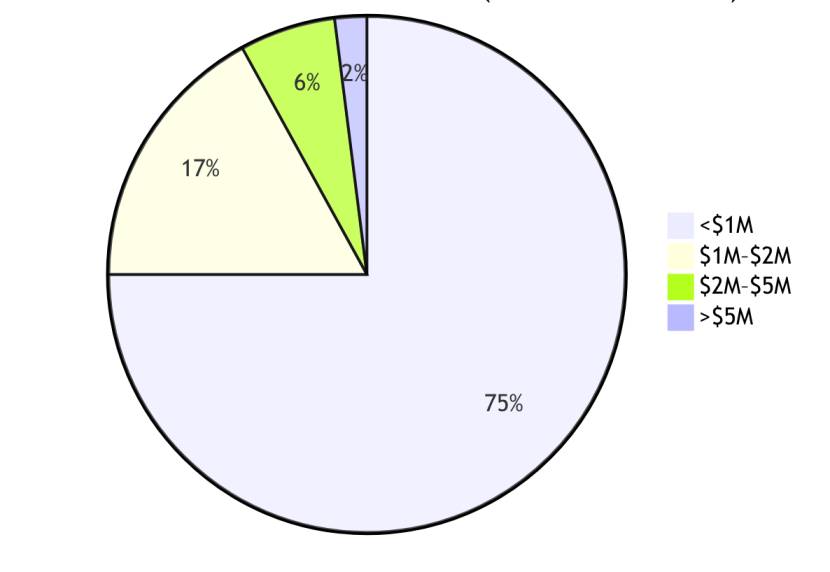
Table 1: Net Worth Percentiles for Retiree Households
| Age of Head | Median (50th) | 75th Percentile | 90th Percentile | ≥ $1M | ≥ $2M |
|---|---|---|---|---|---|
| 65–69 yrs | $393,000 | $1.15M | $2.96M | 30% | 12% |
| 70–74 yrs | $438,700 | $1.23M | $3.00M | 28% | 13% |
| 75–79 yrs | $338,180 | $991,520 | $2.91M | 25% | 10% |
| 80+ yrs | $327,200 | $944,334 | — | 22% | 9% |
To visualize this another way, here’s roughly how all 65-plus households break down by net worth bracket:
| Net Worth Range | Approximate Share of 65+ Households |
|---|---|
| Under $1M | ~75% |
| $1M–$2M | ~17% |
| $2M–$5M | ~6% |
| Over $5M | ~2% |
- 3 out of every 4 retiree households haven’t crossed $1 million.
- Less than 1/12 has crossed $2 million.
Age Cohorts and Household vs Individual
I want to draw a clear line between two distinct groups:
- Early retirees (65–74) and
- Older seniors (75-plus)
Younger retirees hold more wealth.
The median net worth for 65–74 households runs from $392,000 to $438,000, compared to $327,000 to $338,000 for households 75 and older.
The top-percentile thresholds hold roughly steady or decline slightly as the cohort ages.
This isn’t a generational difference, but it’s the natural arc of retirement itself.
- Spending continues in retirement.
- Required minimum distributions force withdrawals.
- Market drawdowns happen at inconvenient times.
- Wealth gets spent down, which is exactly what it’s there for.
By the way, every figure in this report is a household number, not an individual one.
A retired couple’s combined net worth gets reported as a single household figure, the same as a single retiree living alone.
Why So Few Reach $2M?
Several factors explain the rarity of $2 M wealth among retirees:
1. Income and savings rates
American households typically earn modest middle-class incomes and save only 5–15% of earnings.
So, even if they start their career at around 25 and even save $10k annually for 40 years at a 6% return yields only about $1 M (pre-tax).
Most cannot save enough to reach $2 M without high incomes or investment windfalls.
2. Debt and housing
Many retirees carry a mortgage or other debt through much of life.
High home costs mean your savings flow into housing rather than investable assets.
While home equity counts in net worth, it’s illiquid.
Unless you downsize to unlock some home equity, most rely on their home for shelter.
So, although rising home prices have lifted their overall wealth, they have not created $2 M of liquid wealth for most.
3. Longevity and spending
People are living longer, which is wonderful and also financially demanding.
A 20-30, or more years in retirement, requires a much larger nest egg than previous generations needed.
Retirees are also drawing down their savings every single year they’re retired, which is exactly why the 80-plus shows lower net worth than the 65–74 cohort.
Required Minimum Distributions force withdrawals on a schedule whether you need the cash or not, and healthcare costs in later years chip away further at whatever balance remains.
4. Investment returns and fees
Markets have historically rewarded long-term equity exposure, but plenty of retirees underweight stocks out of caution or got hit hard by a poorly timed downturn.
- Low yields on safe assets have kept growth low.
- Fees on retirement accounts and funds can materially reduce compound growth.
5. Policy and contribution limits
Even highly disciplined savers run into a hard ceiling: 401(k) and IRA contribution limits cap out.
So, there’s a structural limit on how fast you can build tax-advantaged savings, no matter how much you earn.
Not every employer offers a generous match either. The policy framework itself puts a speed limit on how quickly most people can accumulate serious wealth through retirement accounts alone.
How Much Should I Have Saved By 30?
Wondering if you’re ahead or behind? Compare your retirement savings with common age-30 benchmarks and see how much you may need to stay on track for the future.
Check Your ProgressFrequently Asked Questions
These statistics are based on household net worth. A household may consist of one person or a couple, so individual wealth cannot be compared on a one-to-one basis.
Yes. Net worth includes home equity, calculated as your home’s market value minus any outstanding mortgage balance.
No. Social Security benefits and pension payments provide retirement income, but they are not counted as assets when calculating net worth.
Some reports examine only 401(k) and IRA balances. Those figures are much lower than total net worth because they exclude assets such as homes, brokerage accounts, businesses, and savings.
Most estimates are based on the Federal Reserve’s 2022 Survey of Consumer Finances, with newer industry data used where appropriate.
Estimates for the wealthiest households are less precise because of smaller sample sizes. However, multiple independent sources consistently show that multi-million-dollar net worth is well above that of the vast majority of households.
References: