
QQQI Review: Yield, Performance, Risks & Monthly Income

QQQI has attracted attention from income-focused investors as Nasdaq-100 stocks continue to play a major role in many portfolios.
It has delivered a 25.70% one-year return at market price, while making monthly distributions.
The fund began trading in January 2024, giving it less than three years of live performance history.
The NEOS Nasdaq-100 High Income ETF (QQQI) is an actively managed, options-based ETF that invests in Nasdaq-100 stocks while writing (selling) covered call options on the Nasdaq-100 Index to generate high monthly income in a tax-efficient manner, with the potential for equity appreciation.
QQQI was launched by NEOS Investments on January 30, 2024, and is often compared to other Nasdaq/S&P income ETFs such as JEPQ, GPIQ, and QYLD.
- Holds a portfolio of Nasdaq-100 stocks (actively managed, not a strict index replication)
- Sells one-month, near-the-money covered call options on the Nasdaq-100 Index (NDX) to generate premium income
- Uses an options overlay designed for greater tax efficiency versus some competing covered-call strategies
- Distributions have historically been classified largely as return of capital
- Pays monthly distributions, though amounts are not guaranteed and can fluctuate
| Metric | Value |
|---|---|
| Share price | $54.39 |
| Assets under management | $14.53B |
| Expense ratio | 0.68% |
| Dividend yield (TTM) | 14.05% |
| Distribution frequency | Monthly |
| 52-week range | $47.87 – $57.84 |
| Beta | 0.94 |
| Number of holdings | 107 |
| 1-year total return | 17.07% |
| Since-inception avg. annual return | 19.27% |
Yield, price, and return figures change daily with market conditions; past distributions and performance are not a guarantee of future results.
- NVIDIA (NVDA) — 8.39%
- Apple (AAPL) — 7.82%
- Microsoft (MSFT) — 5.89%
- Micron Technology (MU) — 4.66%
- Amazon.com (AMZN) — 4.28%
- Advanced Micro Devices (AMD) — 3.74%
- Alphabet (GOOGL) — 3.23%
- Meta Platforms (META) — 3.23%
- Alphabet (GOOG) — 3.00%
- Tesla (TSLA) — 2.90%
Top 10 holdings represent roughly 47% of fund assets; sector exposure is concentrated in technology (~59%) and communication services (~13%).

QQQI Top 10 Holdings
How QQQI Works
QQQI is an options-based equity income ETF. Its principal investment strategies are:
| Step | What QQQI Does | Example |
|---|---|---|
| 1. Owns Nasdaq-100 stocks | Invests in companies in the Nasdaq-100 Index. | QQQI gets exposure to companies such as major technology and growth businesses. |
| 2. Sells call options | Sells Nasdaq-100 call options and collects premiums. | QQQI might collect option premiums in exchange for giving up some upside above certain levels. |
| 3. May buy call options | Can purchase additional call options as part of its strategy. | If the Nasdaq-100 rises significantly, purchased calls can provide additional upside potential. |
| 4. Generates monthly income | Income can come from option premiums, dividends, capital gains and interest. | QQQI can use these sources to make monthly distributions. |
| 5. Trades some upside for income | The options strategy can limit some gains during strong market rallies. | If the Nasdaq-100 jumps sharply, some of that gain may be offset by the calls QQQI sold. |
QQQI Yield and Monthly Dividends
QQQI pays monthly distributions typically declared mid-month, paid a few days later.
- Frequency: Monthly (12x/year).
- Current distribution: ~$0.6518 per share.
- SEC 30-day yield: –0.05%
- 12-mo trailing yield: ~14.08%
- Payout schedule: Typical ex-dividend dates are mid-month, with payment a couple of days later.
| Year | Distribution Paid | Total Distributions | Reported Yield* |
|---|---|---|---|
| 2024 | 11 | $6.73 | 12.85% |
| 2025 | 12 | $7.44 | 13.82% |
| 2026 through Sep. | 9 | $5.72 | 10.53%** |
| Current TTM | 12 | $7.64 | ~14.1% to 14.4% |
Is your retirement plan still on track?
Use this retirement plan review checklist to revisit your savings, investments, taxes, Social Security, healthcare, and income strategy.
Review Your Retirement Plan
QQQI Performance
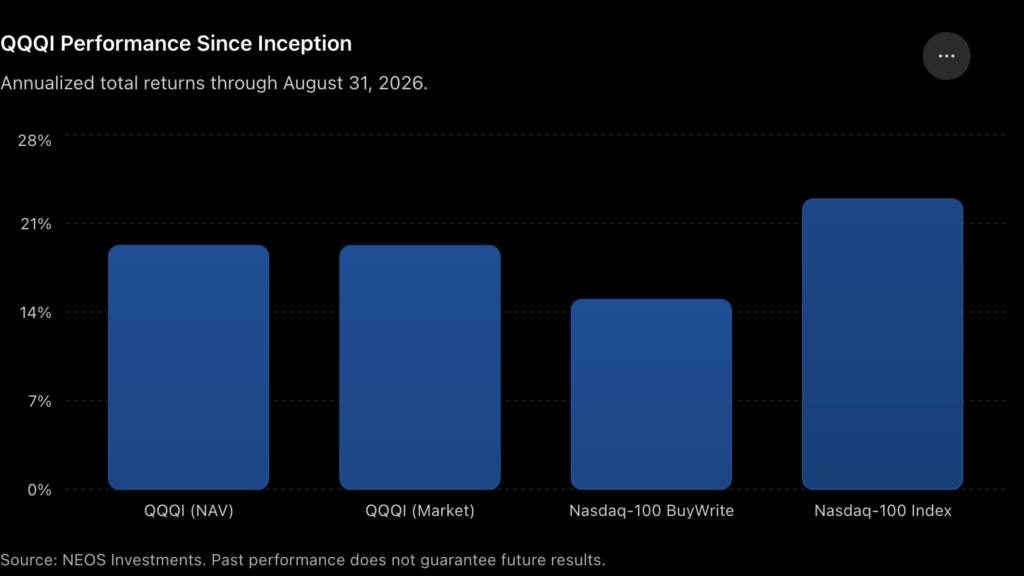
Since its January 2024 inception, QQQI has generated a 19.25% annualized total return at NAV, compared with 22.92% for the Nasdaq-100 Index and 14.99% for the Cboe Nasdaq-100 BuyWrite Monthly Index.
QQQI Fees and Tax
QQQI’s main ongoing fund cost is its 0.68% expense ratio, while its monthly distributions can have different tax classifications depending on the fund’s income and gains.
| Item | QQQI |
|---|---|
| Expense Ratio | 0.68% per year |
| Management Fee | 0.68% |
| 12b-1 Fee | None |
| Trading Costs | Brokerage fees and bid-ask spread may apply |
| Distributions | Monthly |
| Tax Treatment | NDX index options can receive 60% long-term / 40% short-term tax treatment |
| Return of Capital | Some distributions may be classified as ROC, which generally reduces your cost basis |
| Final Tax Reporting | Check your Form 1099-DIV for the actual tax classification |

Pros and Cons
- Pros:
- High Income: Very high distribution yield, paid monthly, attractive for income-oriented investors.
- Tax Efficiency: Uses broad index options, giving 60/40 tax treatment and potential ROC classification.
- Equity Upside: Allows participation in Nasdaq-100 gains and dividends.
- Diversification/Innovation: Exposure to 100 top tech and growth companies, with a strategy uncorrelated to bonds.
- Low Duration Risk: Since it writes options, it naturally has shorter effective duration than bond funds; may act differently in rising-rate environments.
- Cons:
- Capped Upside: Equity upside is limited by call strike prices. In strong bull markets, QQQI will underperform pure Nasdaq funds.
- Complex Tax: Investors must track ROC and capital gains; not as simple as qualified dividends. Cost basis reductions can cause surprises.
- Active Management Risk: Requires skillful option management; performance depends on manager’s timing and selection.
- Tracking Error: Results can deviate from any published index and from pure Nasdaq returns.
- Liquidity/Size: As a new and smaller fund, it may have wider bid-ask on some days compared to very large ETFs.
- Market Risk: Still equity-based, a severe tech selloff could still cause significant loss.
QQQI Risks
- Strategy Risk: If volatility plummets or the market spikes, option premiums may not compensate.
- Equity Risk: QQQI’s equity portfolio is concentrated in U.S. large-cap tech/growth. Major drawdowns in technology stocks will hurt QQQI.
- Call Option Risk: Writing index calls entails the obligation to sell at the strike price.
- Tracking Error: Because it’s actively managed, QQQI may deviate from both the underlying index and the theoretical buy-write index.
- Liquidity Risk: QQQI’s shares are exchange-traded and can be created/redeemed in blocks by authorized participants, which normally keeps market price close to NAV.
- Concentration Risk: Although diversified across 100 stocks, the Nasdaq-100 is heavily weighted to a few companies.
Comparison vs QQQ, JEPQ, QYLD
| Fund | Strategy | Distribution Rate | Expense Ratio | 1-Year Return |
|---|---|---|---|---|
| QQQI | Active options income | 14.39% | 0.68% | 19.21% |
| QQQ | Nasdaq-100 index | Low | 0.18% | 34.10% |
| JEPQ | Options income + stocks | ~11% | 0.35% | 19.80% |
| QYLD | Covered calls | 12.06% | 0.60% | 24.37% |
The four ETFs have different approaches to generating income and participating in Nasdaq-100 growth.
So their distribution rates and recent total returns should be viewed separately rather than treated as equivalent measures of performance.
Who Is QQQI For & Not Suitable For?
QQQI is designed for income-focused investors who want exposure to high-growth NASDAQ-100 equities but prioritize yield.
Who Is QQQI For?
- Income-Focused Investors: Want monthly distributions from Nasdaq-100 exposure.
- Nasdaq-100 Investors: Want market exposure with an income strategy.
- Options Investors: Comfortable with an options-based ETF.
- Income-Over-Growth Investors: Willing to trade some upside for income.
Who Is QQQI Not For?
- Pure Growth Investors: Want straightforward Nasdaq-100 exposure.
- Low-Risk Investors: Want stable income with minimal principal risk.
- Options-Averse Investors: Prefer funds without derivatives.
- Low-Fee Investors: Prioritize the lowest possible expense ratio.
- Guaranteed-Income Seekers: Expect fixed or guaranteed monthly distributions.
QQQI ETF FAQ
QQQI is an ETF that invests in Nasdaq-100 companies and uses covered-call strategies to generate monthly income. The fund launched in January 2024.
QQQI generates income by selling Nasdaq-100 index call options and collecting the option premiums.
QQQI typically pays distributions monthly, with the ex-dividend date usually occurring around the middle of the month.
QQQI’s yield changes over time because its monthly distributions vary. Check the fund’s latest distribution and yield figures for the current rate.
QQQI invests in companies from the Nasdaq-100 but uses an active covered-call strategy, so it does not simply track the index.
QQQI uses covered calls to generate income, while QQQ primarily tracks the Nasdaq-100 without a covered-call strategy. QQQI can provide more income but may give up some upside when the market rises sharply.
QQQI distributions can include return of capital, capital gains, and other income, so the tax treatment can vary. Check your Form 1099-DIV and the fund’s tax information for the breakdown.
QQQI has a net expense ratio of 0.68%.
Yes. QQQI can lose value when the Nasdaq-100 declines, although option income may offset some losses.
QQQI trades on the Nasdaq like other ETFs, but its trading volume and bid-ask spreads can differ from larger ETFs such as QQQ.
Yes. QQQI can be held in an eligible IRA, although its equity and covered-call risks should still be considered when choosing investments for retirement.
References:






4 Comments